Tidal Charts
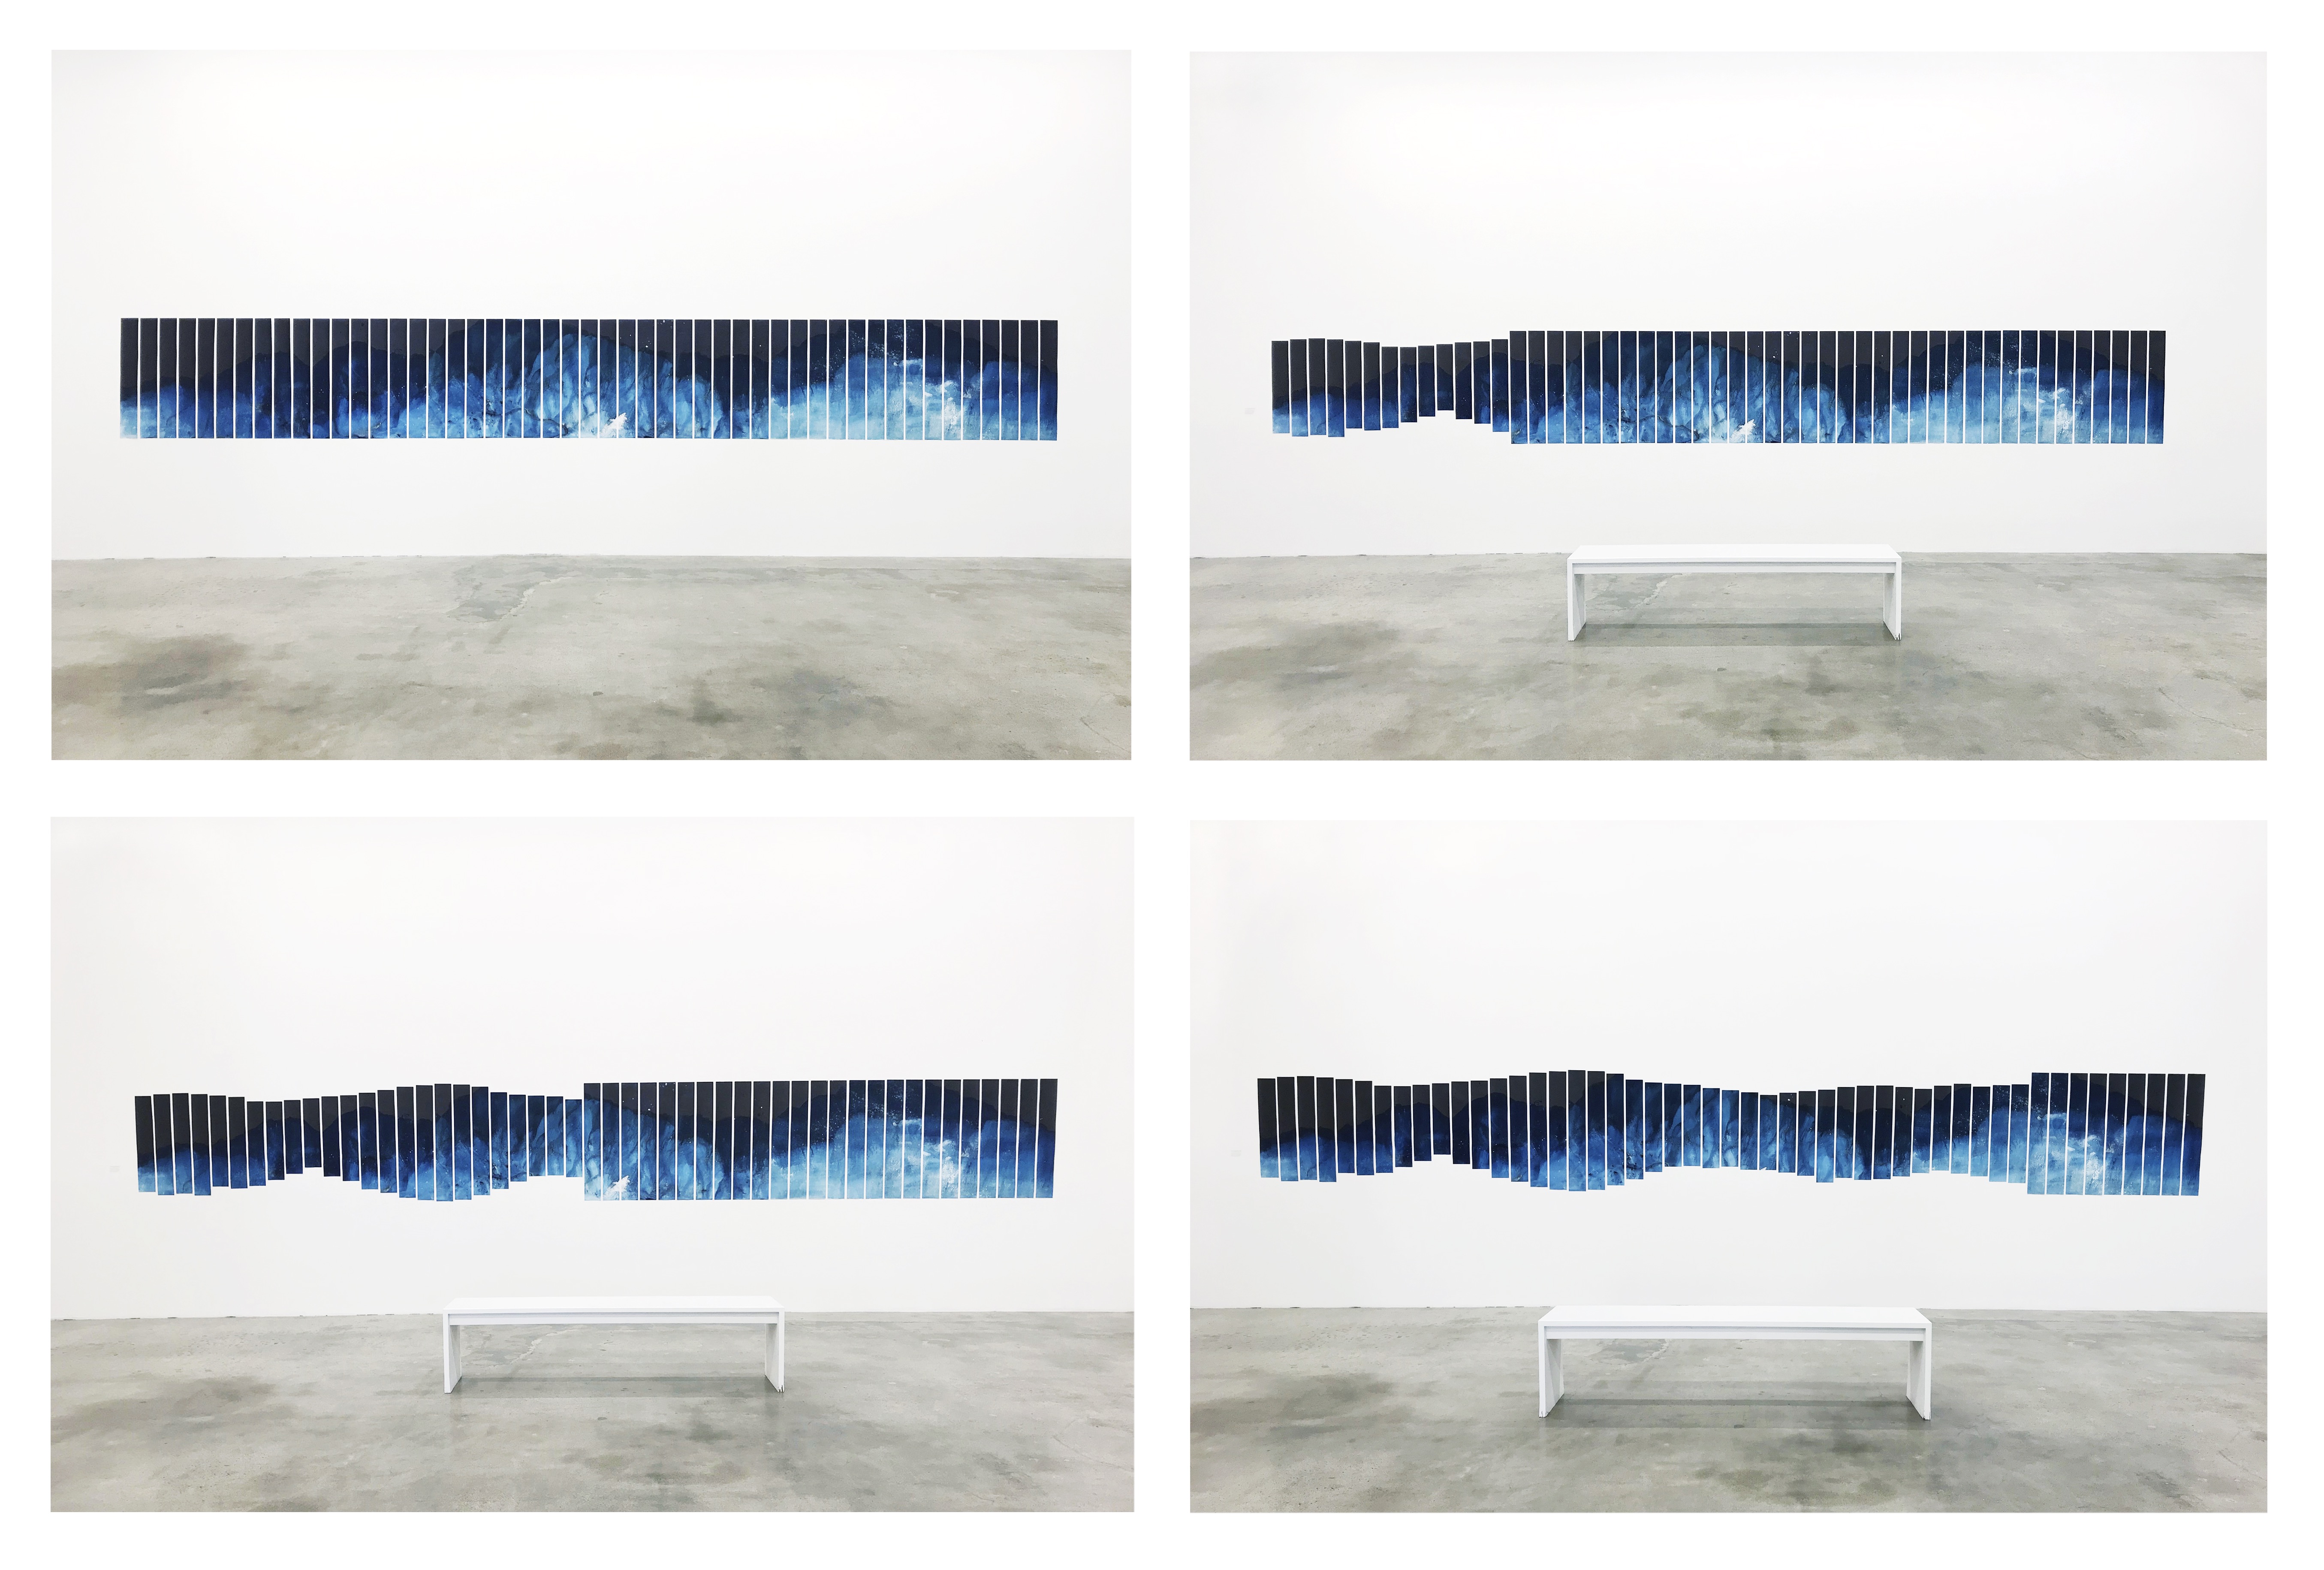
Tidal Chart II: Daily NOAA Tide Predictions, San Francisco Bay, CA 02.12.18-03.31.18 evolves in response to the tides of the San Francisco Bay. There is one element for each day of the exhibition, forty-nine in total. Each day, an element is cut to represent the Bay’s highest and lowest tides as predicted by the National Oceanic and Atmospheric Association.
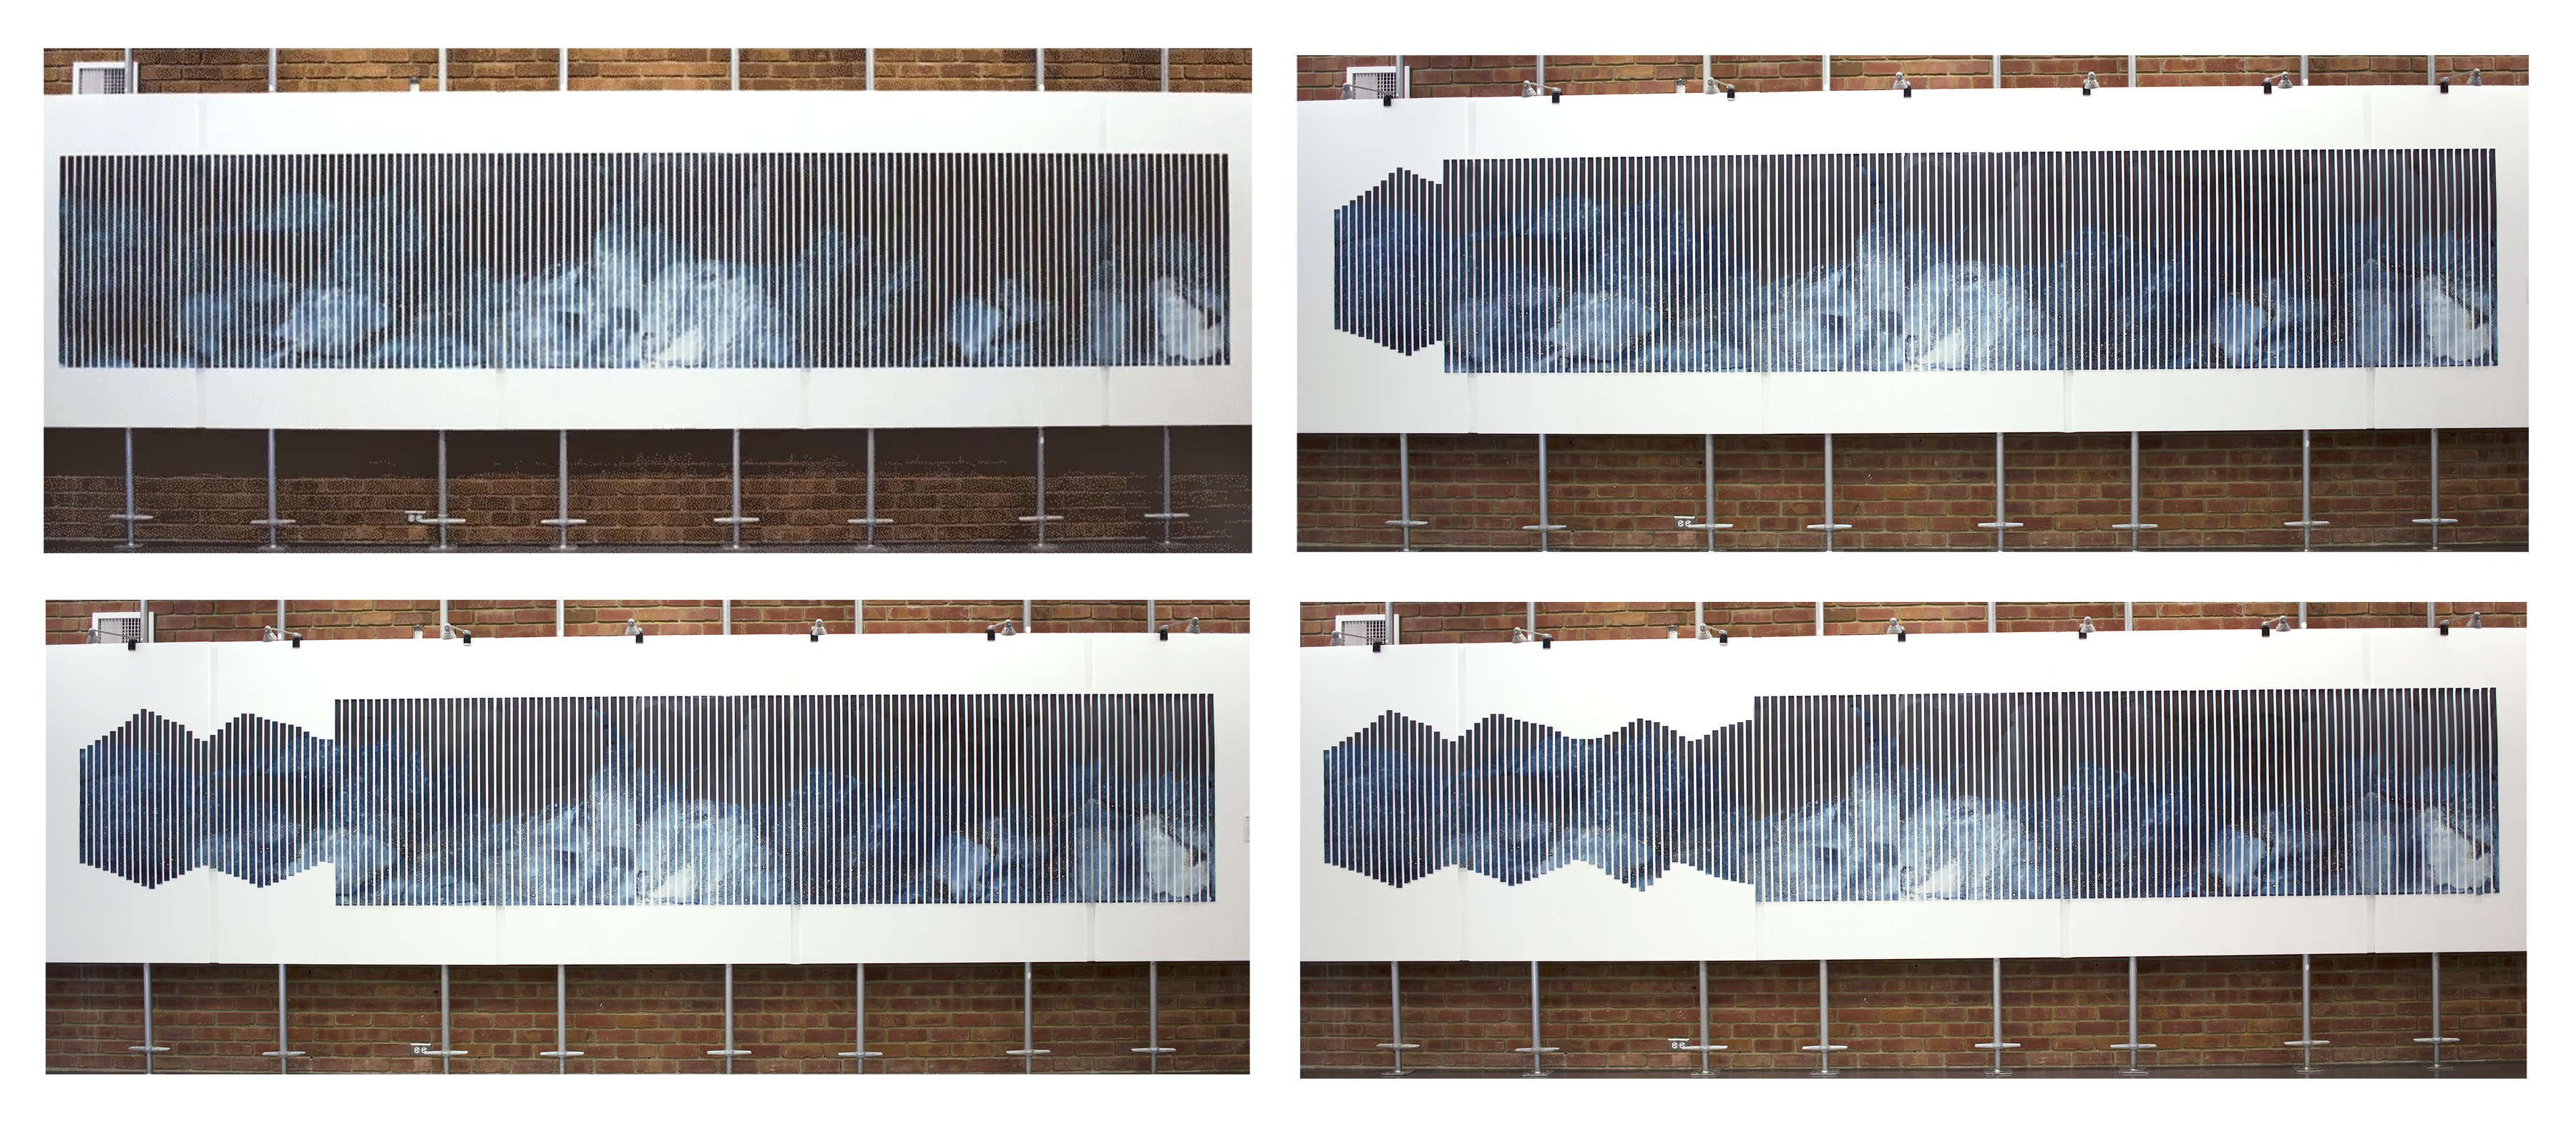
Tidal Chart V: Daily NOAA Tide Predictions, Half Moon Bay, CA 07.10.20-10.29.20