Tidal Charts
Statement
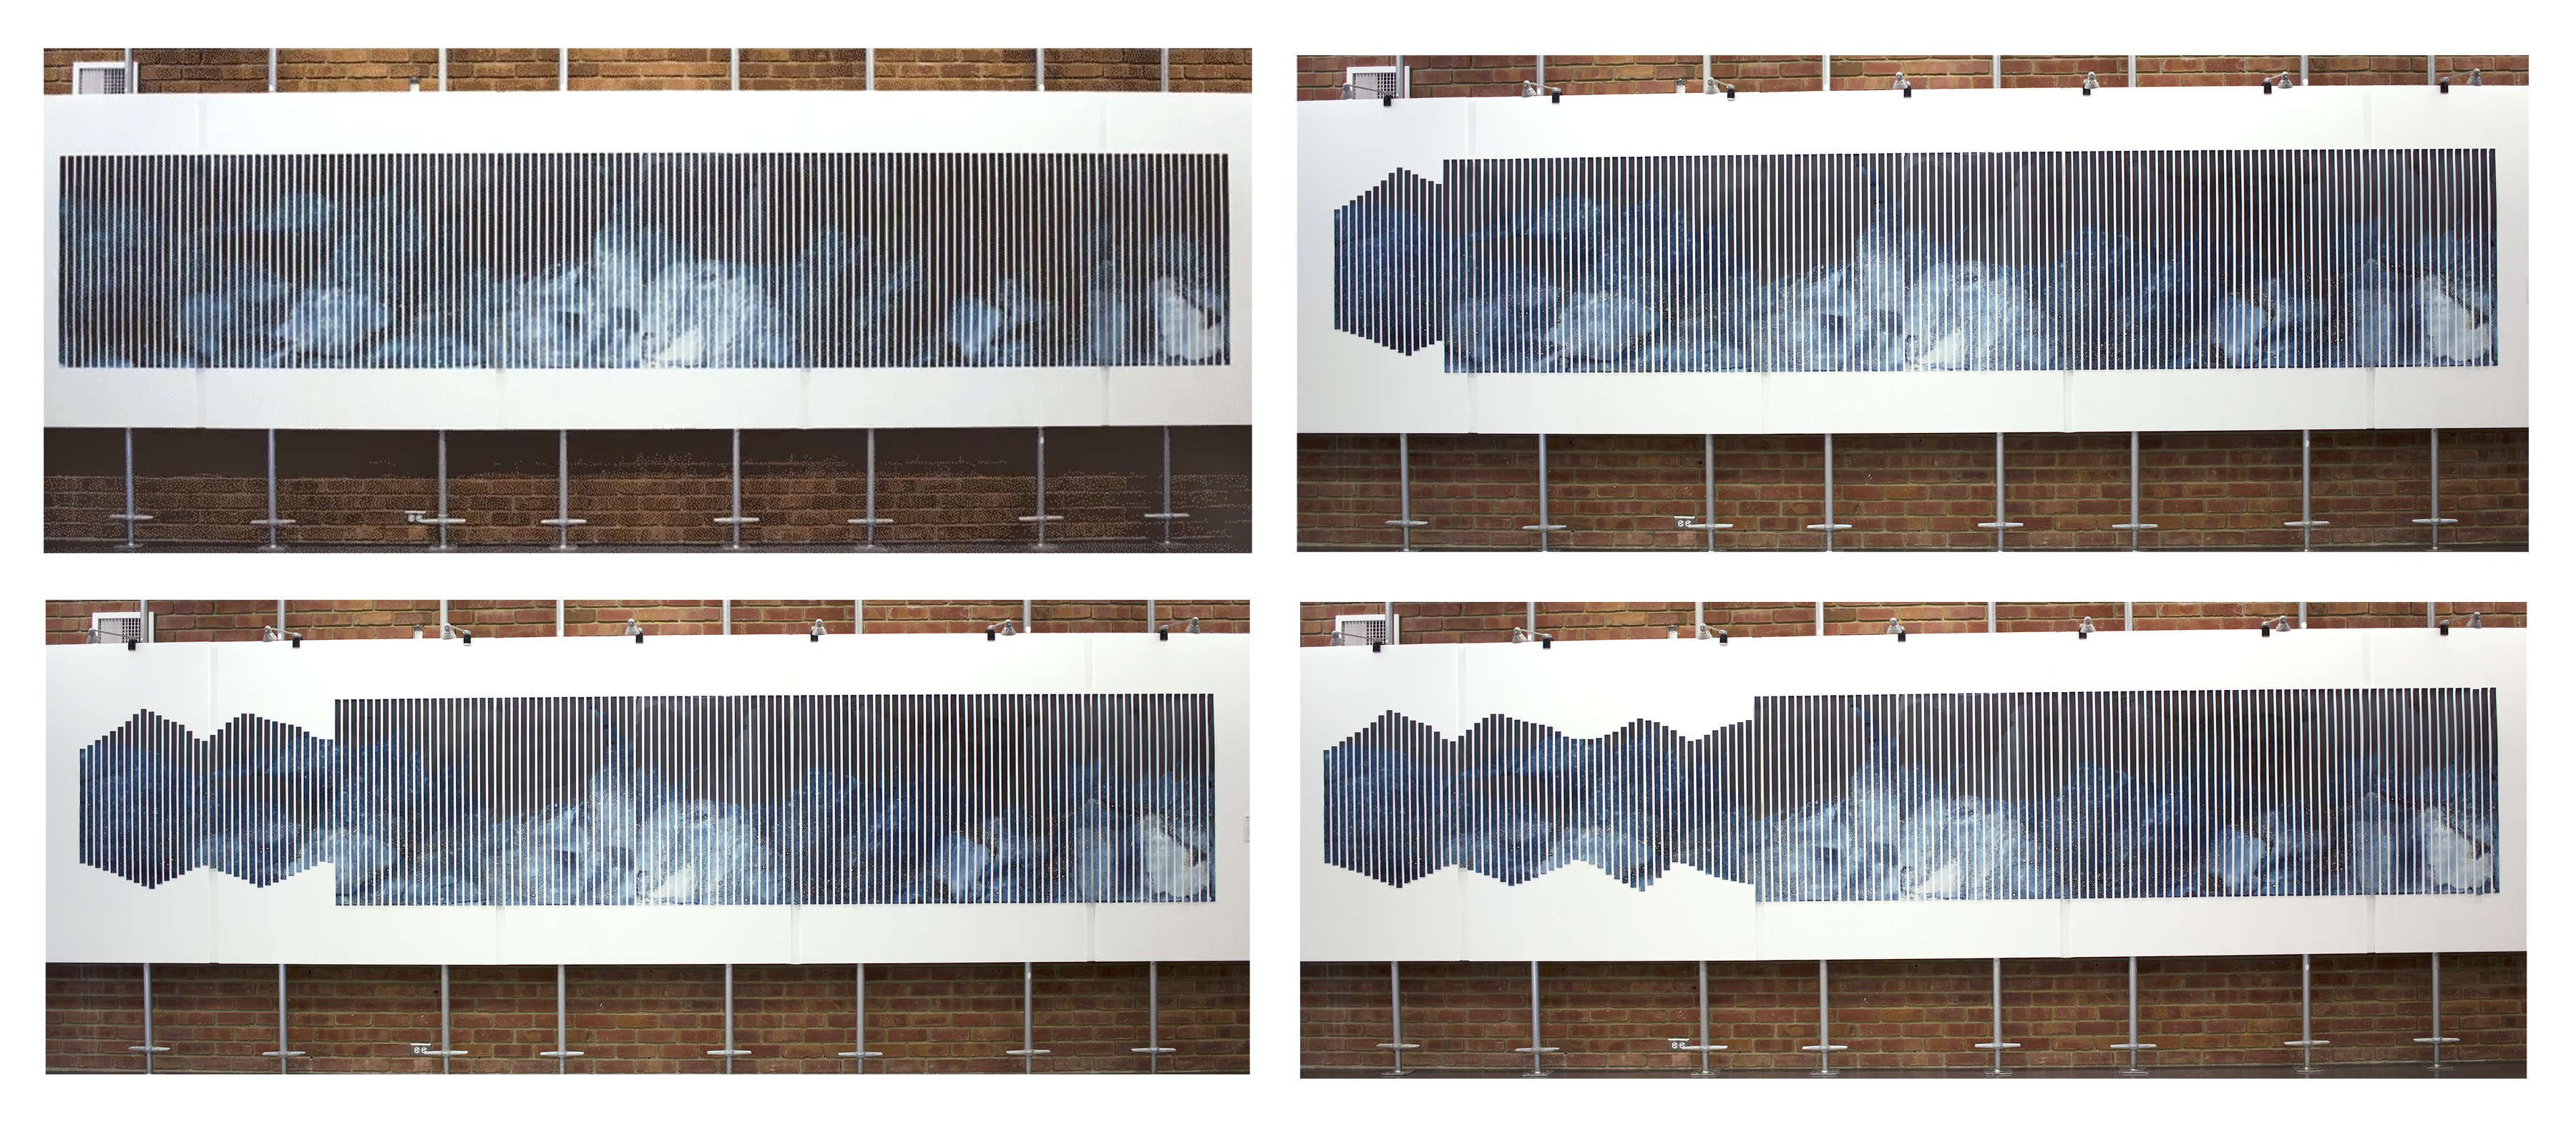
Tidal Charts are exhibition specific pieces that evolve in response to tidal predictions from the National Oceanic and Atmospheric Association. There is one element per exhibition day, and each day an element is cut to represent the highest and lowest tides from that day. I make the source cyanotype—the object that is cut up—at the water with a NOAA station closest to the exhibition space.
Tidal Charts are ruminations on the larger cycles going on around us; we live our lives and have hopes and dreams and life events and highs and lows, and all the while sea and the moon conspire in their rhythmic pattern.
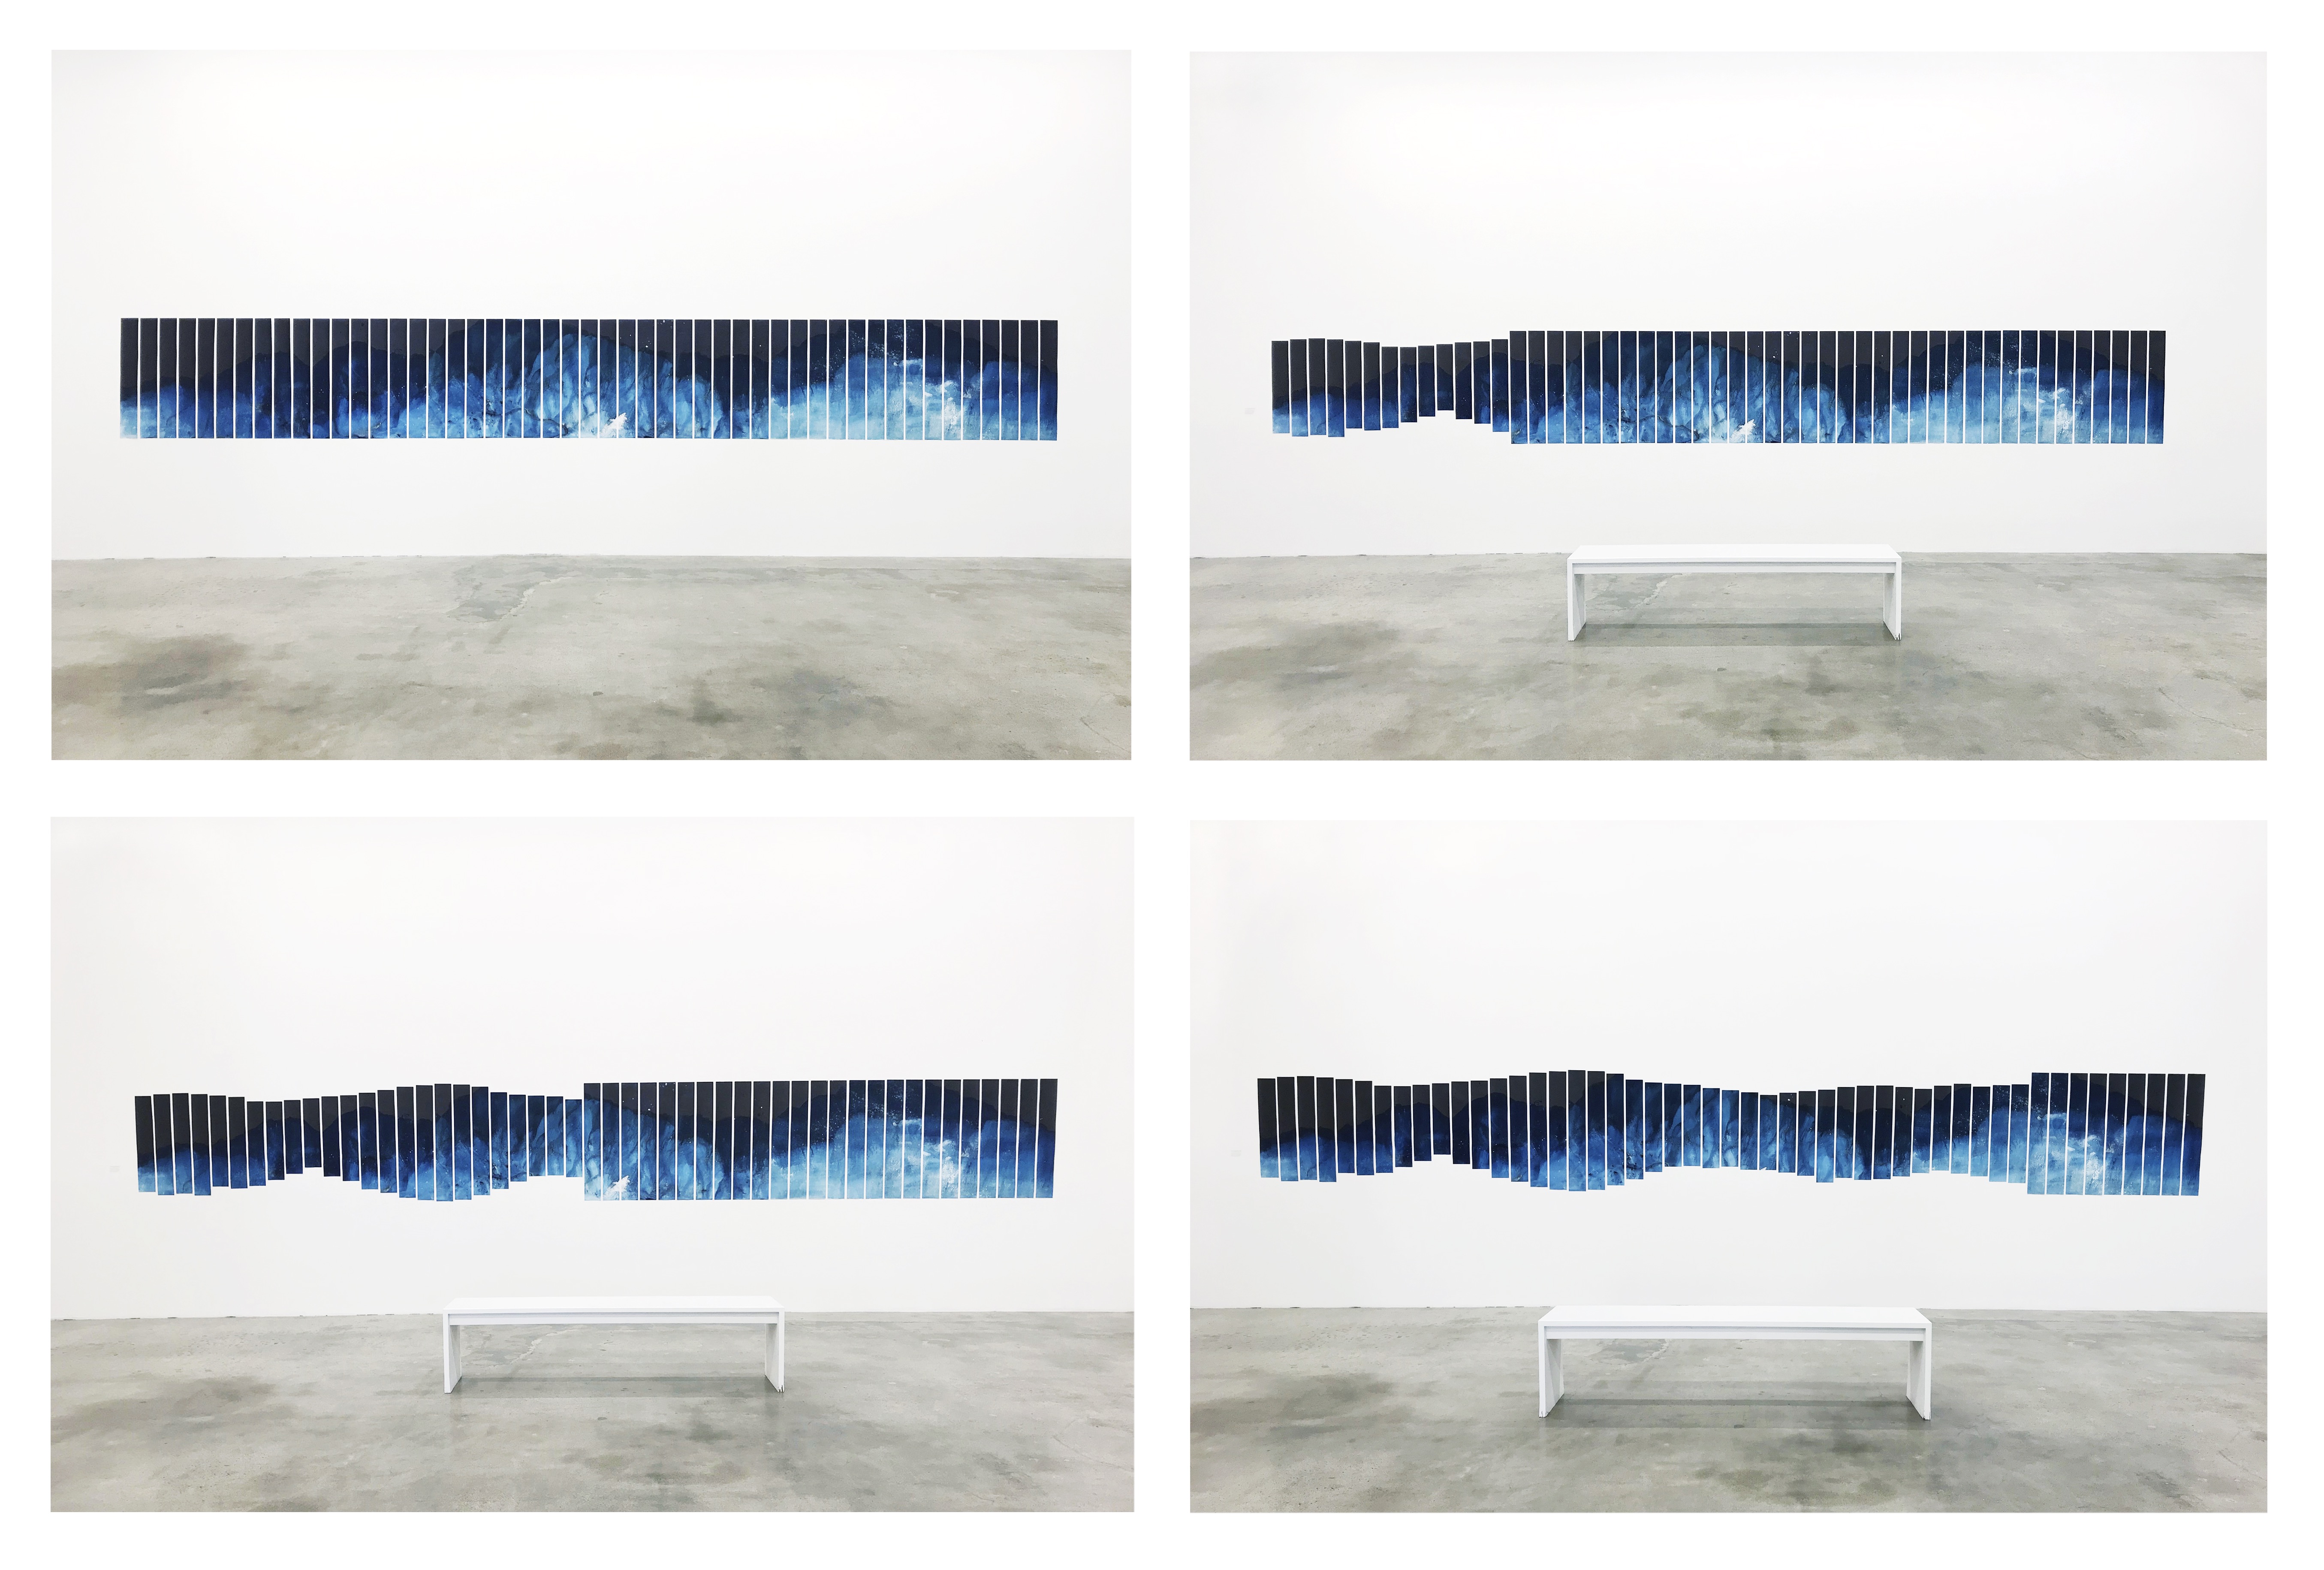
Tidal Chart II: Daily NOAA Tide Predictions, San Francisco Bay, CA 02.12.18-03.31.18 evolves in response to the tides of the San Francisco Bay. There is one element for each day of the exhibition, forty-nine in total. Each day, an element is cut to represent the Bay’s highest and lowest tides as predicted by the National Oceanic and Atmospheric Association.